Collating energy usage data
Matthew Wilkes on 2020-12-26In the book, I explore writing a data collection and aggregation system using Raspberry Pis, with temperature and humidity sensors attached. Using a plugin system, I also include a sensor implementation to collect generation data from my solar panels. Recently I had a SMETSv2 Smart Meter installed, using Octopus Energy as my electricity supplier. As they provide an API for usage data, I decided to add a new sensor type to gather import data too.
To that end, I recently started hacking on apd.octopusenergy. This is an example of a facade, a system to convert one API to another. The Octopus Energy API appears to be written with resellers in mind, but it's very useful for power-users (if you'll excuse the pun). There was no chance it would exactly match our API definition, but the data is compatible so we can write code to convert between the two.
The first step was to make some sample requests and then wrap them in something approximating a functioning sensor. The prototyping work is available on GitHub.
This kind of code is rather frustrating to test, as it involves copying live API responses and mocking them out. The better defined and documented an API is, the easier it is to get the required information from documentation, but it's not a good match for hacking around on a December evening.
Instead, once I had a working sensor I ploughed ahead and installed it on one of the Raspberry Pis providing data to the central aggregation process, and allowed data to start passing in. The final version of the data collector is shown in Listing 1
Listing 1. The Octopus Electricity Sensorimport datetime
import os
import requests
import typing as t
from pint import _DEFAULT_REGISTRY as ureg
from apd.sensors.base import HistoricalSensor
from apd.sensors.exceptions import (
PersistentSensorFailureError,
IntermittentSensorFailureError,
)
class OctopusPowerUsage(HistoricalSensor[t.Any]):
def value(self) -> t.Optional[t.Any]:
raise PersistentSensorFailureError("Only historical data is available")
def historical(
self, start: datetime.datetime, end: datetime.datetime
) -> t.Iterable[t.Tuple[datetime.datetime, t.Any]]:
start = start.replace(microsecond=0)
end = end.replace(microsecond=0)
url = f"https://api.octopus.energy/v1/{self.fuel}-meter-points/{self.mpan}/meters/{self.serial}/consumption/"
f"?period_from={start.isoformat()}&period_end={end.isoformat()}&page_size=25000"
data = requests.get(url, auth=(self.api_key, ""))
for item in data.json()["results"]:
yield (
datetime.datetime.fromisoformat(item["interval_end"].strip("Z")),
ureg.Quantity(item["consumption"], self.unit)
)
@classmethod
def format(cls, value: t.Any) -> str:
return "{:~P}".format(value.to(ureg[self.unit]))
@classmethod
def to_json_compatible(cls, value: t.Any) -> t.Dict[str, t.Union[str, float]]:
return {"magnitude": value.magnitude, "unit": str(value.units)}
@classmethod
def from_json_compatible(cls, json_version: t.Any) -> t.Any:
return ureg.Quantity(json_version["magnitude"], ureg[json_version["unit"]])
class OctopusElectricityUsage(OctopusPowerUsage):
name = "OctopusElectricityUsage"
title = "Electricty Usage"
fuel = "electricity"
unit = "kilowatthours"
def __init__(
self, api_key="", serial="", mpan=""
) -> None:
self.api_key = os.environ.get(
"APD_OCTOPUS_API_KEY", api_key
)
self.mpan = os.environ.get(
"APD_OCTOPUS_ELECTRICITY_MPAN", mpan
)
self.serial = os.environ.get(
"APD_OCTOPUS_ELECTRICITY_SERIAL", serial
)This allows multiple instances of the general sensor to be created, ready for when my natural gas smart meter is installed. To support these changes, I've also made some adjustments to the API, to allow for individual sensors historical data to be queried in a more light-weight way. This is completely transparent to the sensor, we can define a historical method and trust that the sensors and aggregation packages will cause this data to be transferred and stored appropriately.
The upshot of this is that data is stored in the SQL database for the aggregation process, as shown in Listing 2.
Listing 2. Results of SELECT * FROM datapoints WHERE sensor_name='OctopusElectricityUsage' AND data IS NOT null ORDER BY collected_at DESC; id | sensor_name | collected_at | data | deployment_id
---------+-------------------------+---------------------+-----------------------------------------------+--------------------------------------
1298849 | OctopusElectricityUsage | 2020-12-24 23:30:00 | {"unit": "kilowatt_hour", "magnitude": 0.189} | 5aaa901a-7564-41fb-8eba-50cdd6fe9f80
1298850 | OctopusElectricityUsage | 2020-12-24 23:00:00 | {"unit": "kilowatt_hour", "magnitude": 0.172} | 5aaa901a-7564-41fb-8eba-50cdd6fe9f80
1298851 | OctopusElectricityUsage | 2020-12-24 22:30:00 | {"unit": "kilowatt_hour", "magnitude": 0.119} | 5aaa901a-7564-41fb-8eba-50cdd6fe9f80
1298852 | OctopusElectricityUsage | 2020-12-24 22:00:00 | {"unit": "kilowatt_hour", "magnitude": 0.142} | 5aaa901a-7564-41fb-8eba-50cdd6fe9f80
1298853 | OctopusElectricityUsage | 2020-12-24 21:30:00 | {"unit": "kilowatt_hour", "magnitude": 0.155} | 5aaa901a-7564-41fb-8eba-50cdd6fe9f80
1298854 | OctopusElectricityUsage | 2020-12-24 21:00:00 | {"unit": "kilowatt_hour", "magnitude": 0.17} | 5aaa901a-7564-41fb-8eba-50cdd6fe9f80
This data is somewhat different to the data returned by the solar panel connection, as this shows kilowatt hours consumed and the solar inverter returns watt hours total, as shown in Listing 3.
Listing 3. Data from the solar inverter id | sensor_name | collected_at | data | deployment_id
---------+-----------------------+----------------------------+------------------------------------------------+--------------------------------------
1282016 | SolarCumulativeOutput | 2020-12-24 10:35:11.089506 | {"unit": "watt_hour", "magnitude": 17000470.0} | 53998a51-60de-48ae-b71a-5c37cd1455f2
1281941 | SolarCumulativeOutput | 2020-12-24 10:20:11.268129 | {"unit": "watt_hour", "magnitude": 17000432.0} | 53998a51-60de-48ae-b71a-5c37cd1455f2
1281843 | SolarCumulativeOutput | 2020-12-24 10:00:10.604379 | {"unit": "watt_hour", "magnitude": 17000406.0} | 53998a51-60de-48ae-b71a-5c37cd1455f2
1281723 | SolarCumulativeOutput | 2020-12-24 09:40:11.22605 | {"unit": "watt_hour", "magnitude": 17000387.0} | 53998a51-60de-48ae-b71a-5c37cd1455f2In order to design some useful analysis functions we will need to normalise this data, but that's a question for a future blog post. In the mean-time, I'll share the result of the charts that can be generated by following the methodology in the book. The result is shown as Figure 1.
Figure 1. A chart of both power generated and imported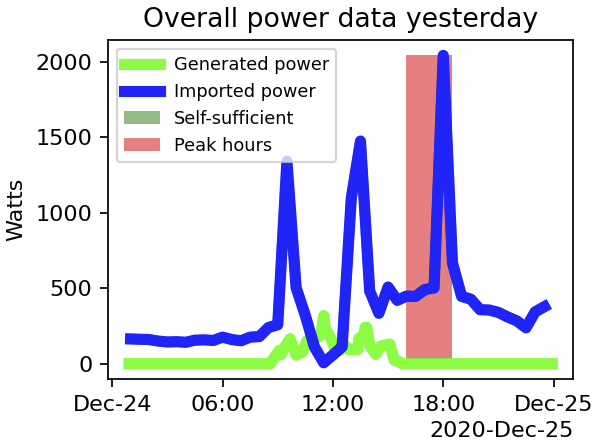
If the idea of aggregating this (and other) data from your home appeals, and you'd like to do so while learning about modern, professional-standard Python development, Advanced Python Development is available from all good booksellers (and Amazon). Purchase links are available in the header and from the publisher.